Impedance Measurement of Microbeads
In this application note, we present our Electrical Impedance Spectroscopy Platform (EISP) consisting of microfluidic flow controllers from Fluigent to maintain precise flow control, a chip from Micronit Microtechnologies B.V. to localize impedance measurements, and a lock-in amplifier from Zurich Instruments to perform impedance measurements. We demonstrate the system’s effectiveness for impedance measurement of microbeads by determining the size of micrometer beads and by measuring the generation rate of water-in-oil droplets.
What is Electrical Impedance Spectroscopy?
Microfluidics allows for precise monitoring and control of chemical or biological events at the microscale level. Microfluidic detection and analysis of single cells at this scale, which is equivalent to the dimensions of the biological cell, is a very interesting analytical tool that enables point-of-care and lab-on-a-chip applications (1).
To perform impedance measurements of microbeads, an electrical impedance spectroscopy (EIS) system is required. EIS is a label-free technique that enables real-time, high-throughput measurements and facilitates the process of data extraction and processing (2). Continuous high-throughput detection and classification of single cells or particles (such as beads or droplets) can be achieved using microfluidic devices with embedded microelectrodes for electrical measurements. Furthermore, impedance spectroscopy can be used to distinguish between different types of cells, since a biological cell’s dielectric properties are determined by its cellular features such as cell volume, content, and architecture (1).
Why use electrical impedance spectroscopy for the impedance measurement of microbeads?
This technique has several key advantages, including fast throughput, the ability to analyze multiple parameters, and good integration with other analytical methods (e.g., optical detection).
In this application note, we present a microbead impedance measurement technique using our Electrical Impedance Spectroscopy Platform (EISP), consisting of microfluidic flow controllers from Fluigent to maintain precise flow control, a chip from Micronit Microtechnologies B.V. to localize impedance measurements, and a lock-in amplifier from Zurich Instruments to perform impedance measurements. We demonstrate the system’s effectiveness by determining the size of micrometer beads and by measuring the generation rate of water-in-oil droplets.
Impedance measurement with our EISP
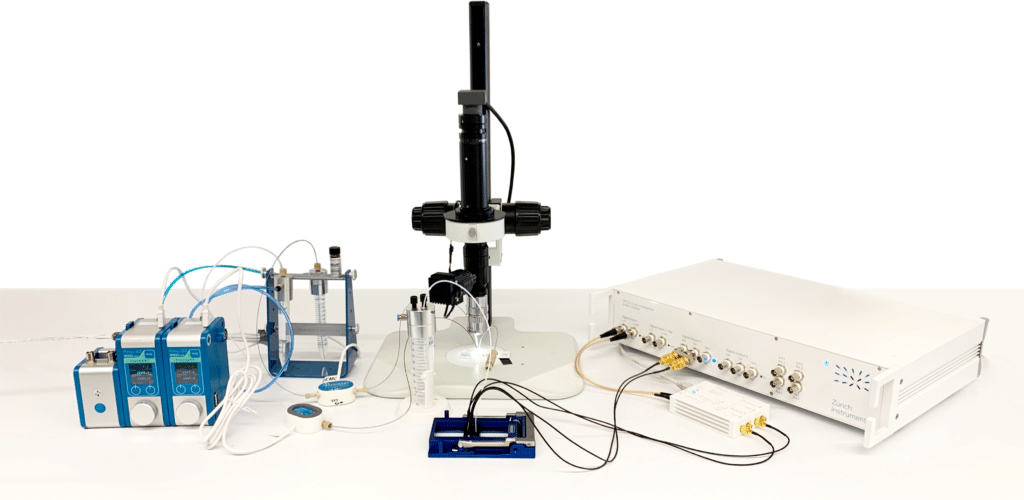
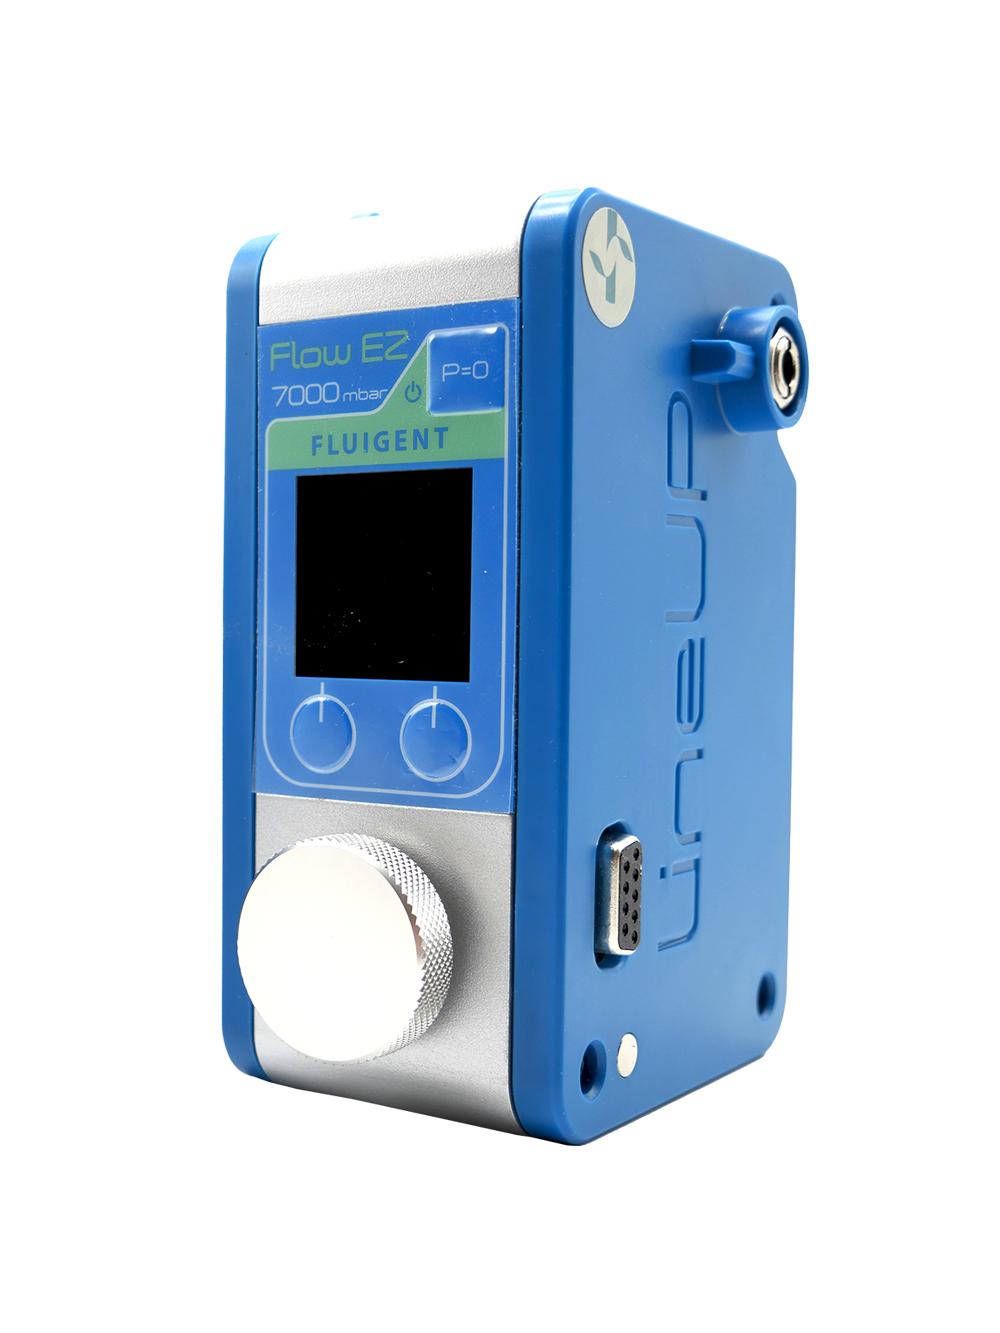
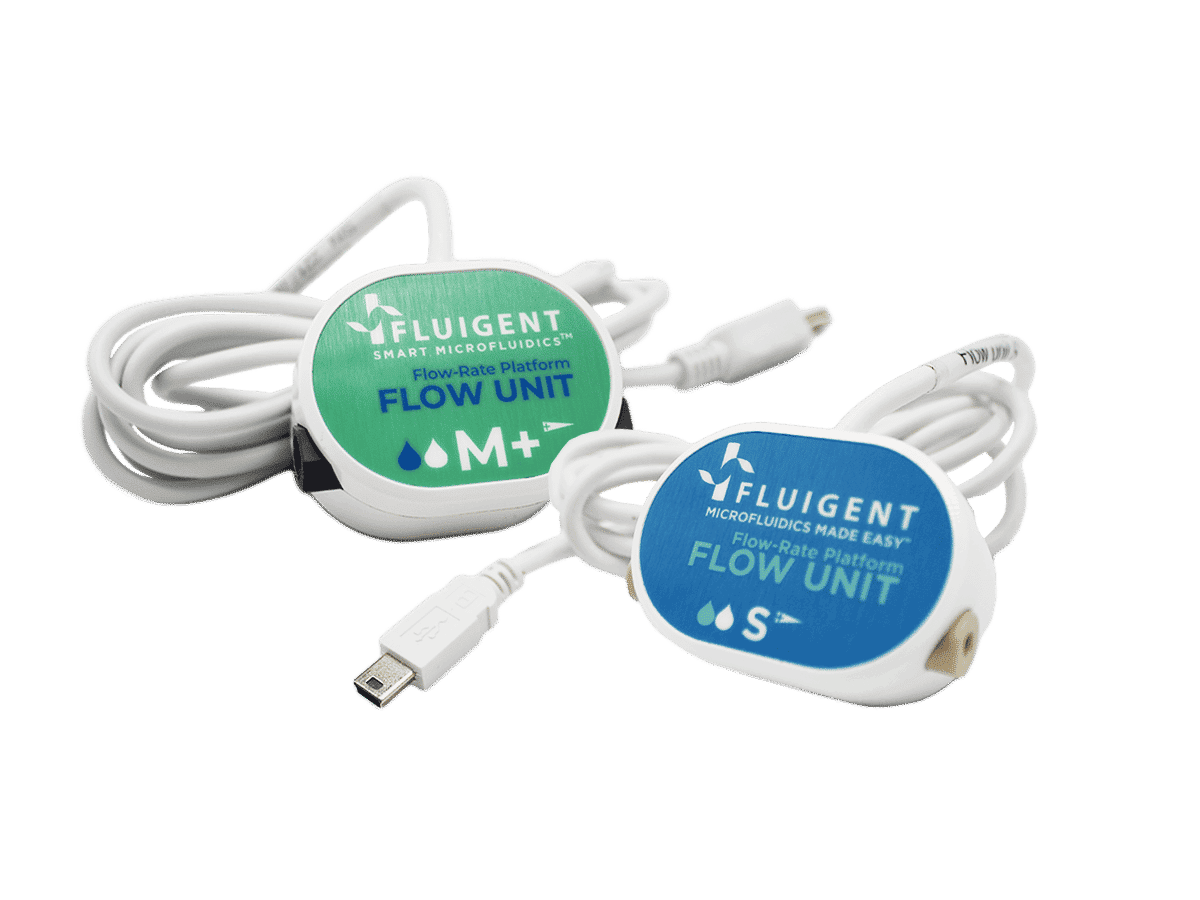
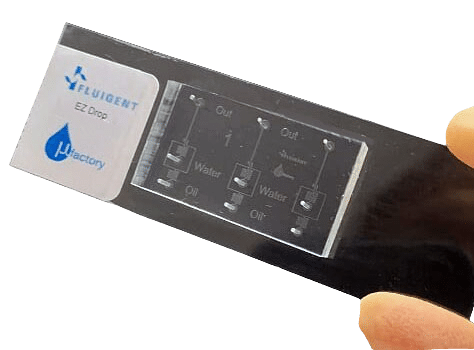
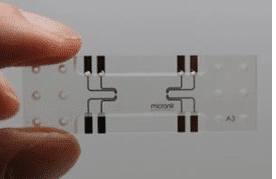
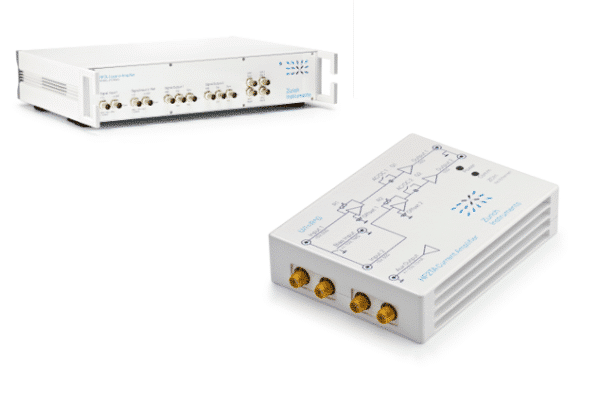
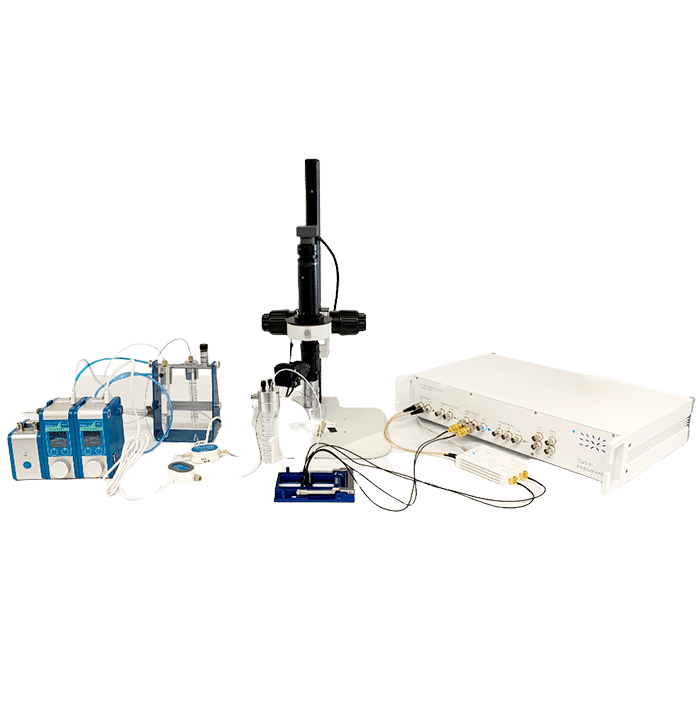
Two Fluigent Flow EZ flow controllers are connected to the EZ Drop chip for droplet generation. The tubing passes through Flow Units to monitor and regulate flow. The generated droplets flow into the Micronit Electrical Impedance Spectroscopy (EIS) chip. The Zurich Instruments HF2LI Lock-in amplifier with HF2TA transimpedance current amplifier is connected to the Micronit EIS chip to measure electrical signals for characterization and monitoring. Visualization of the EZ Drop chip channels is performed with an optical microscope.
Materials
Protocols steps
Impedance analysis of microparticles and water-in-oil droplets
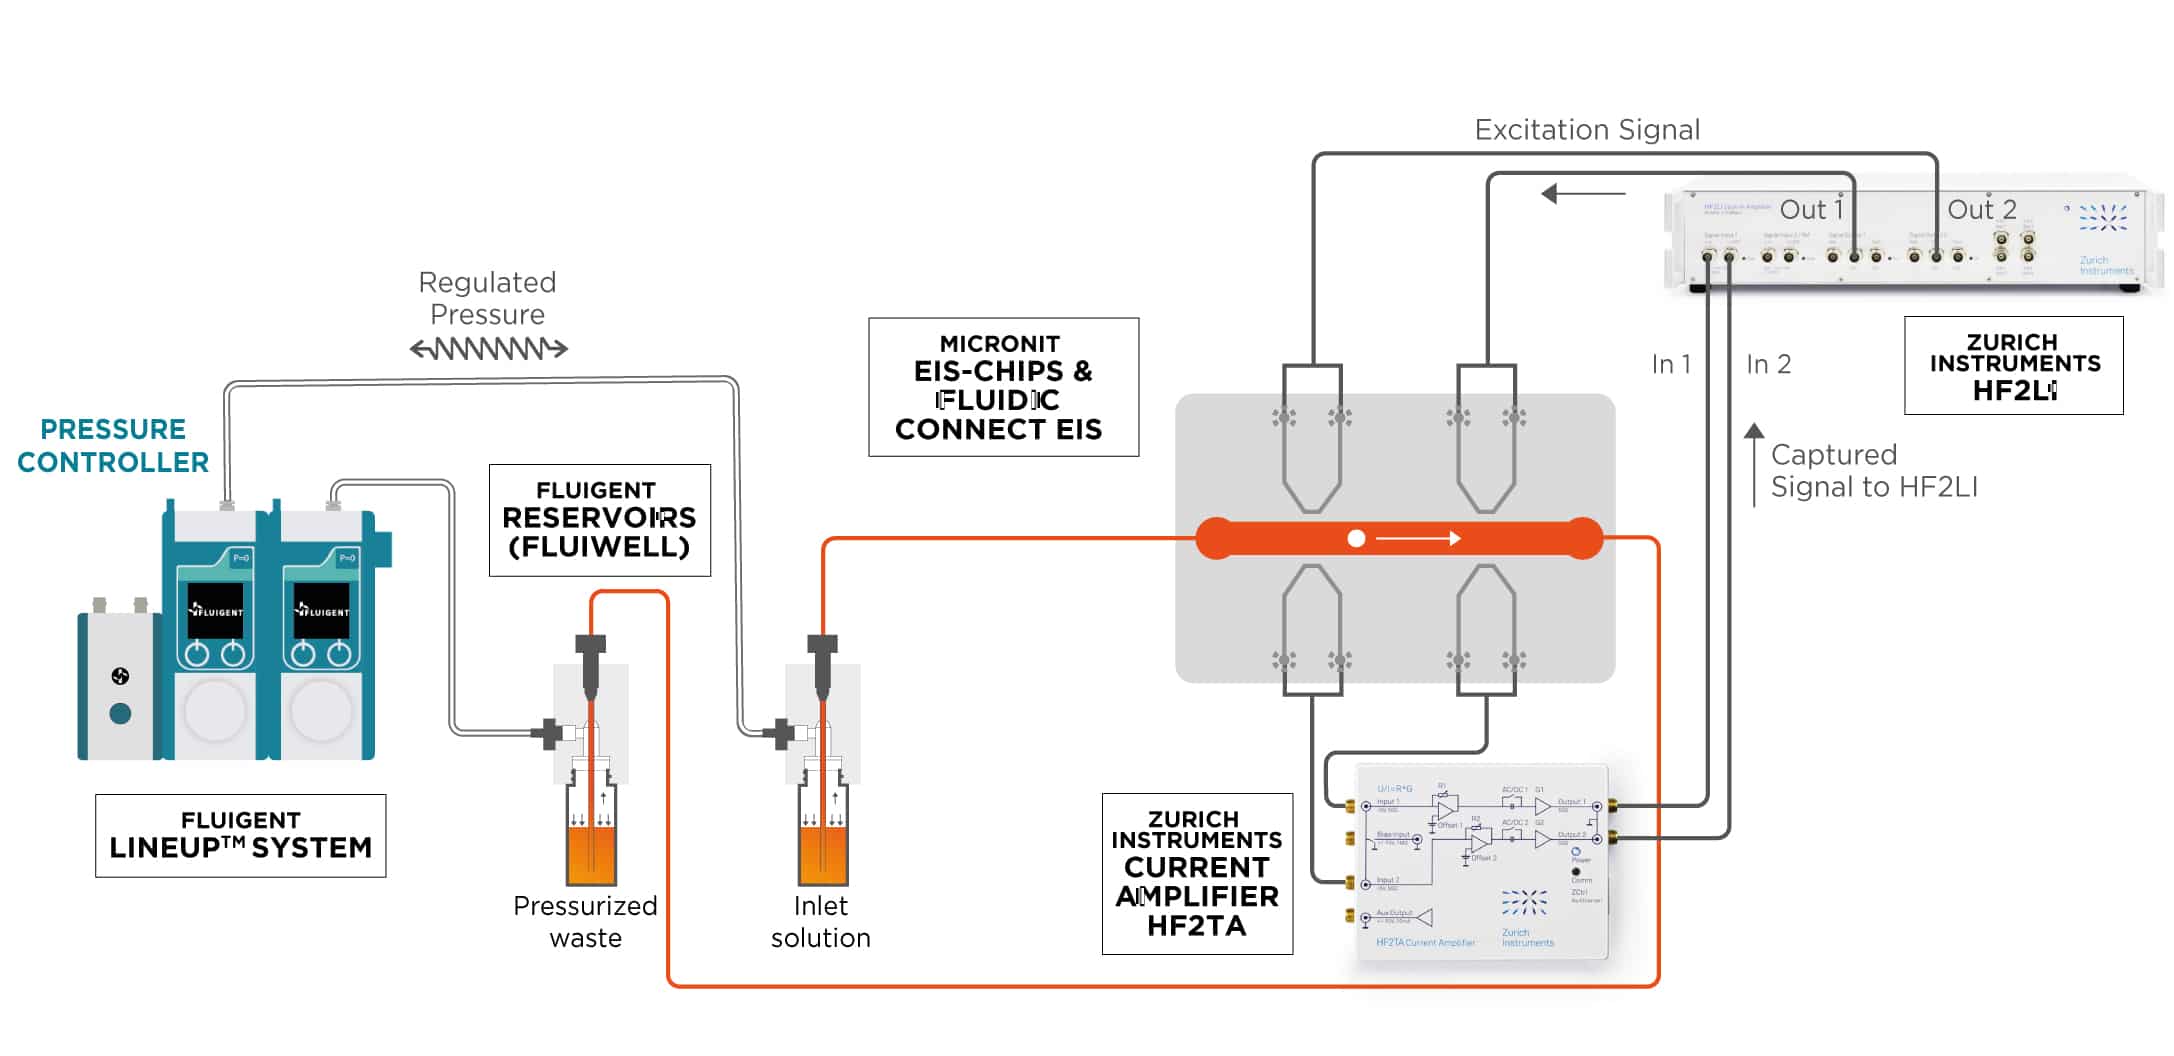
A schematic diagram of the microfluidic setup is presented in the figure above. An external pressure source is connected to the LineUp System consisting of two Flow EZ flow controllers. One reservoir contains the microbead suspension to be injected (inlet solution) and the second reservoir is used to collect the solution coming out of the chip (pressurized waste). The reservoirs are connected to the EIS microfluidic chip via tubing. The microbeads pass the electrode pairs within the chip and impedance measurements are performed using the HF2LI lock-in amplifier coupled with the HF2TA current amplifier. The experiment is performed using beads of 3 µm and 5 µm diameter.
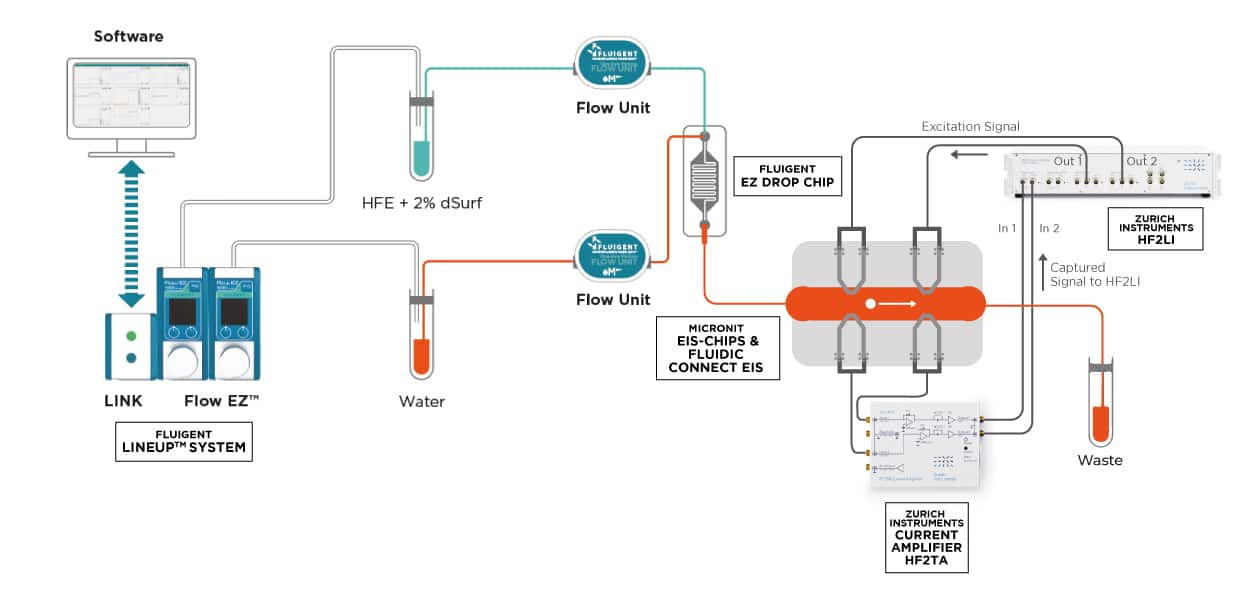
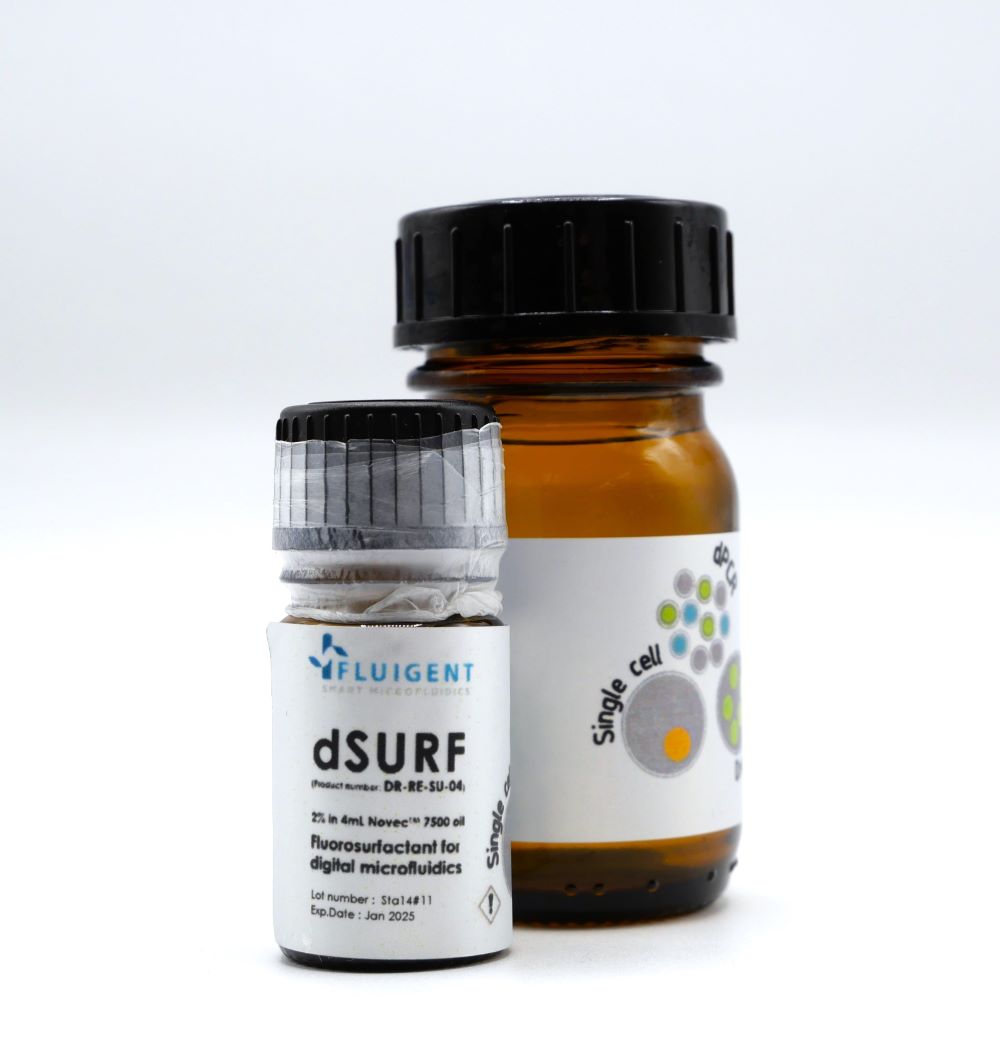
Here, an external pressure source is connected to the LineUp System consisting of two Flow EZ units, which are in turn connected to two reservoirs containing water and 3M™ Novec™ 7500 with dSurf. The reservoirs are connected to the two inlets of the EZ Drop microfluidic chip via tubing. The tubing passes through Flow Units to allow for flow rate measurement. Pressure is applied to the two reservoirs: water is injected into the inner channel and the oil phase is injected into the surrounding channel of the microfluidic chip. Visualization of the chip channels is performed using an optical microscope. For the impedance analysis of microparticles, droplets are generated and flow through the outlet tubing to be injected into the EIS microfluidic chip. The droplets pass the electrode pairs within the chip, and impedance measurements are performed using the HF2LI lock-in amplifier coupled with the HF2TA current amplifier.
Results
Impedance measurement of microbeads
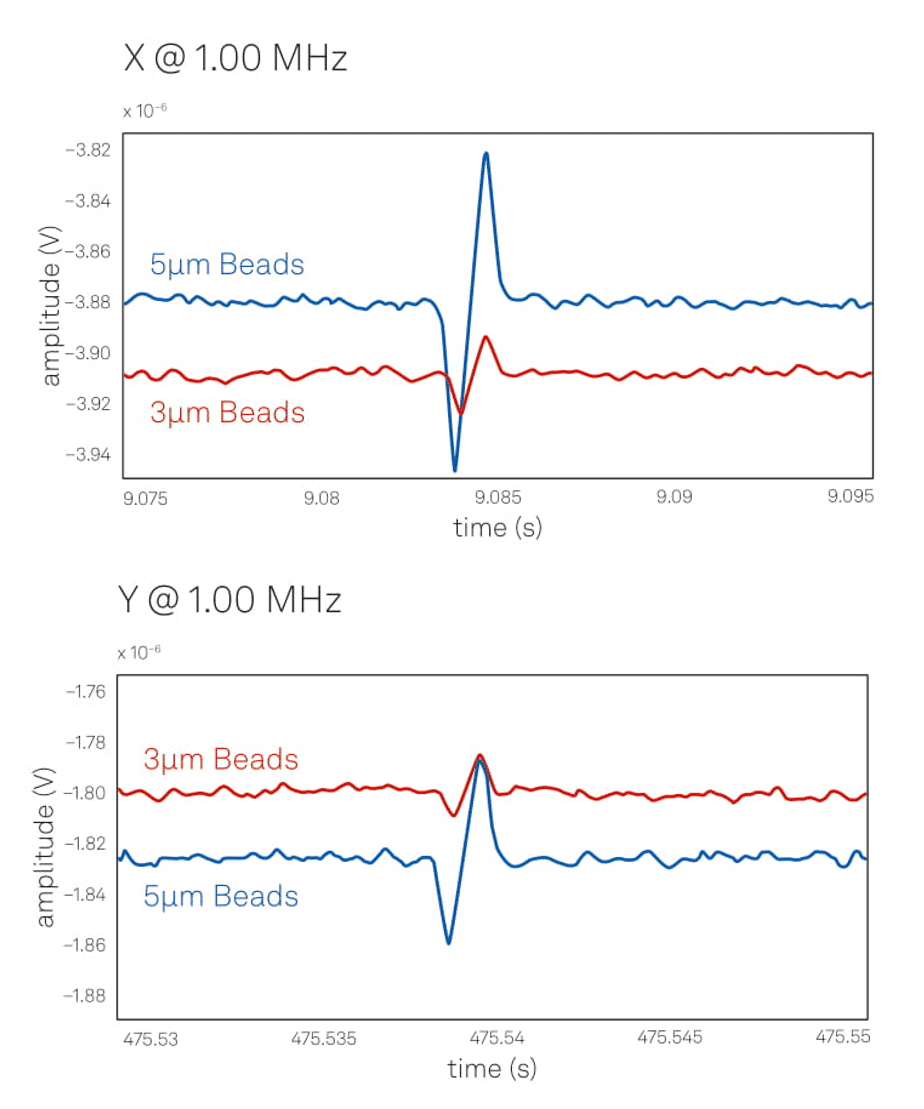
Using the same microfluidic system presented in Figure 3, microbead suspensions are injected into the EIS chip, where beads pass electrode pairs surrounding the microfluidic channel, allowing impedance measurements to be performed.
The figure above shows that the signals from the 5 μm beads (blue trace) display consistently larger amplitudes than the 3 μm beads (red trace) in both X and Y. The 5 μm beads show a peak-peak amplitude change between 75 and 120 mV, versus 20 for 30 mV for the 3 μm beads. These results correspond nicely to the difference in volume between the two beads (a factor of 4.6). The impedance spectroscopy signal can thus be used to discriminate particles or cells according to their size, making it possible to differentiate between 3 µm and 5 µm beads when using our microfluidic system.
Impedance measurement of water-in-oil droplets
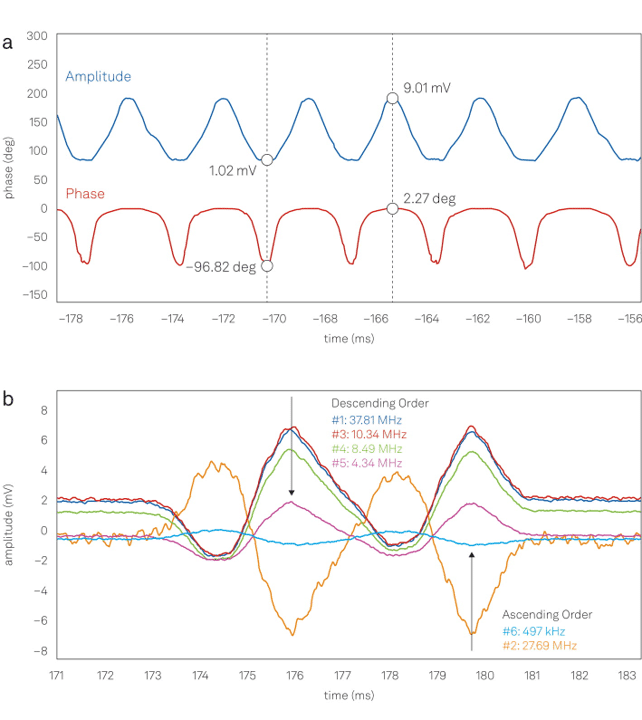
To delve one step further, the experiment is repeated using the same microfluidic system presented in the “Protocol steps” section above. Water-in-oil droplets are injected into the EIS chip, where the droplets pass electrode pairs surrounding the microfluidic channel, allowing impedance measurements to be performed.
The impedance at 10 MHz is shown in the image at left. As each droplet crosses the electrode pair, there are distinct peaks in both the current’s amplitude and phase. The phase information shows a distinct change from resistive (fluid only) to capacitive behavior when the droplets cross the sensing region of the electrode pair. In addition, peak density in the time-domain chart provides important details on droplet generation rate and velocity. Consequently, this method may be used to count even quickly moving beads, droplets, or cells.
Conclusion
We have demonstrated the effectiveness of our cost-effective EISP by determining the size of micrometer beads and by measuring the generation rate and velocity of water oil droplets. Combining the LineUp system with the EIS-chip and the HF2LI lock-in amplifier enables fast detection and discrimination of individual cells or particles in flow at a speed unavailable to camera-based solutions. In addition, this label-free technique can distinguish particle sizes and cell types thanks to its high sensitivity at different frequencies.
More broadly, the Electrical Impedance Spectroscopy Platform offers a diverse range of uses on the microfluidic scale, including applications such as:
- Quality control in the food industry
- Flow cytometry for counting and sorting of cells or droplets, marker-free detection and protein engineering
- Blood analysis
References
- Panwar, J. & Roy, R. Integrated Field’s metal microelectrodes based microfluidic impedance cytometry for cell-in-droplet quantification. Microelectron. Eng. 215, 111010 (2019).
- Zhou, Y. et al. Characterizing Deformability and Electrical Impedance of Cancer Cells in a Microfluidic Device. Anal. Chem. 90, 912–919 (2018).
- Cahill, B. P. Optimization of an impedance sensor for droplet-based microfluidic systems. Smart Sensors, Actuators, MEMS V 8066, 80660F (2011).
